Checking the Resource Usage of Your Server
The control panel provides a monitoring console to collect and analyze the performance data, helping you effectively monitor and compare your server performance over time. Whenever and wherever you are, follow the steps below, you will be available to keep track of the health of your application.
1. Locate your server
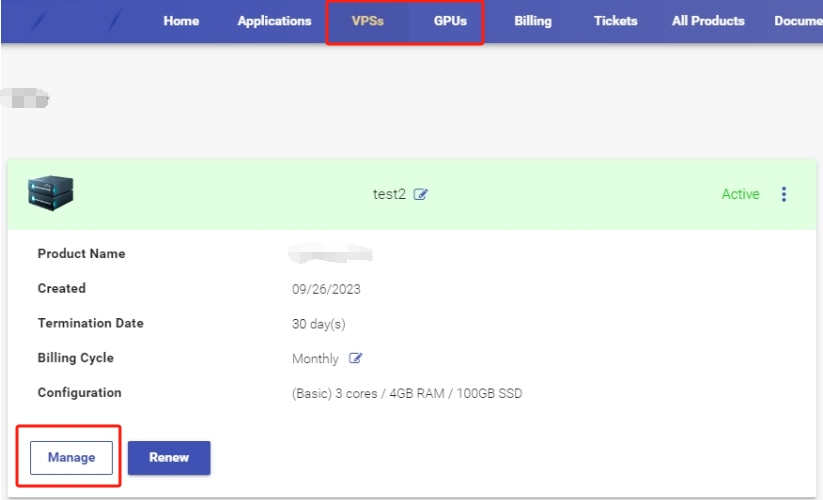
Please log in to the Control Panel with your credentials. Then locate your target server in the control panel.

2. Go to the Overview page
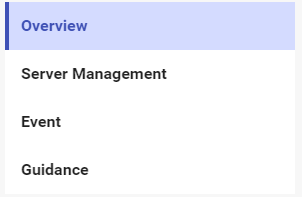
Click the Manage button, followed by the Overview tab in the left navigation bar.

3. Check the Real-Time status
Scroll down to the Real-Time Status section. The section shows each server's status and resource usage, including CPU, RAM, disk space, and server status.
CPU: CPU usage refers to the percentage of processing power consumed by your virtual server's central processing unit (CPU) at a given time. Higher CPU usage generally means that your server is actively processing tasks and handling requests. Excessive CPU usage over an extended period may indicate resource constraints or inefficient code execution, which can lead to performance degradation or even server instability.
RAM: RAM is a short-term memory. It temporarily stores (remembers) everything currently running on an instance, like all OS-specific services and any web browser, image editor. If your RAM is full, the intance could be running slowly.
Disk Space: Disk Space is the maximum amount of data a disk, or drive is capable holding. A hard drive that's too full can slow down your instance, causing freezes and crashes.
Status: Status refers to the current state or condition of the server. It indicates whether the server is running, stopped, or experiencing any issues. It helps server administrators identify any issues or abnormalities that may require attention or troubleshooting to maintain optimal performance and availability.
